While working at previous engagement, we frequently needed to spin up large numbers of browser sessions to automate tasks across various websites.
The traditional approach is to run Chromium inside containers and expose a DevTools endpoint using the --remote-debugging flag. Architecturally, it looks like this:
Puppeteer client (Devtools) ⇌ Chromium Remote Debugging Server (Devtools)The main challenge with this setup is that the Chromium Remote Debugging Server don't become available instantly, it takes time for the browser to start. This forces you to repeatedly poll for reachability, which introduce complexity and instability.
Also, because DevTools communicates strictly over TCP/IP, any lost packets can instantly break the session. Which is an issue that happens on about 1% of the sessions in production.
One way to solve this would be to use a reverse connection model. Instead of waiting for the client to connect to the Chromium Remote Debugging Server, we could make the Chromium Remote Debugging part connect to a central server. Or even better, a publish and subscribe stream through Redis, which would handle buffering for us:
Puppeteer client (Devtools) ⇌ Puppeteer Server (Devtools) ⇌ Redis (Redis) ⇌ Chromium Remote DebuggingUnfortunately, Chromium doesn’t support Redis, or any similar messaging layers, out of the box. Most setups work around this by introducing an additional intermediate layer that forward packets by connecting in between the Redis and Devtools.
Puppeteer client (Devtools) ⇌ Puppeteer Server (Devtools) ⇌ Redis (Redis) ⇌ Redis to devtool translation ⇌ Chromium Remote DebuggingWhile functional, this approach adds even more moving parts, which hurts both speed and reliability. So instead of layering on additional components, I want to take this a step further and integrate Redis support directly into Chromium’s DevTools server.
Let's dive in.
Chromium's Codebase
Chromium’s codebase is enormous. Whenever I work with a project of this size, I start with a full-text search to locate the areas I care about, then work my way up the call tree to understand the surrounding architecture. With Chromium, however, there are a few additional things worth knowing before diving in.
If you plan to work on Chromium yourself, I highly recommend reading the documentation files scattered throughout the repository. Many are outdated, but they provide valuable historical context and help clarify why certain systems exist and how they fit together.
Here’s a high-level look at how the major pieces of Chromium fit together:
- Blink (Rendering Engine):
third_party/blink/ - V8 (JavaScript Engine):
v8/ - Net (Network Stack):
net/ - Mojo (IPC framework): handles communication between components such as the browser process and renderer process —
mojo/, with legacy code inipc/ - Content (Browser Engine): a reusable, platform-agnostic browser engine
content/ - Chrome — the actual Chrome browser implementation built on top of all the above —
chrome/
About devtools
In our case, DevTools lives inside the Browser Engine, under content/browser/devtools:
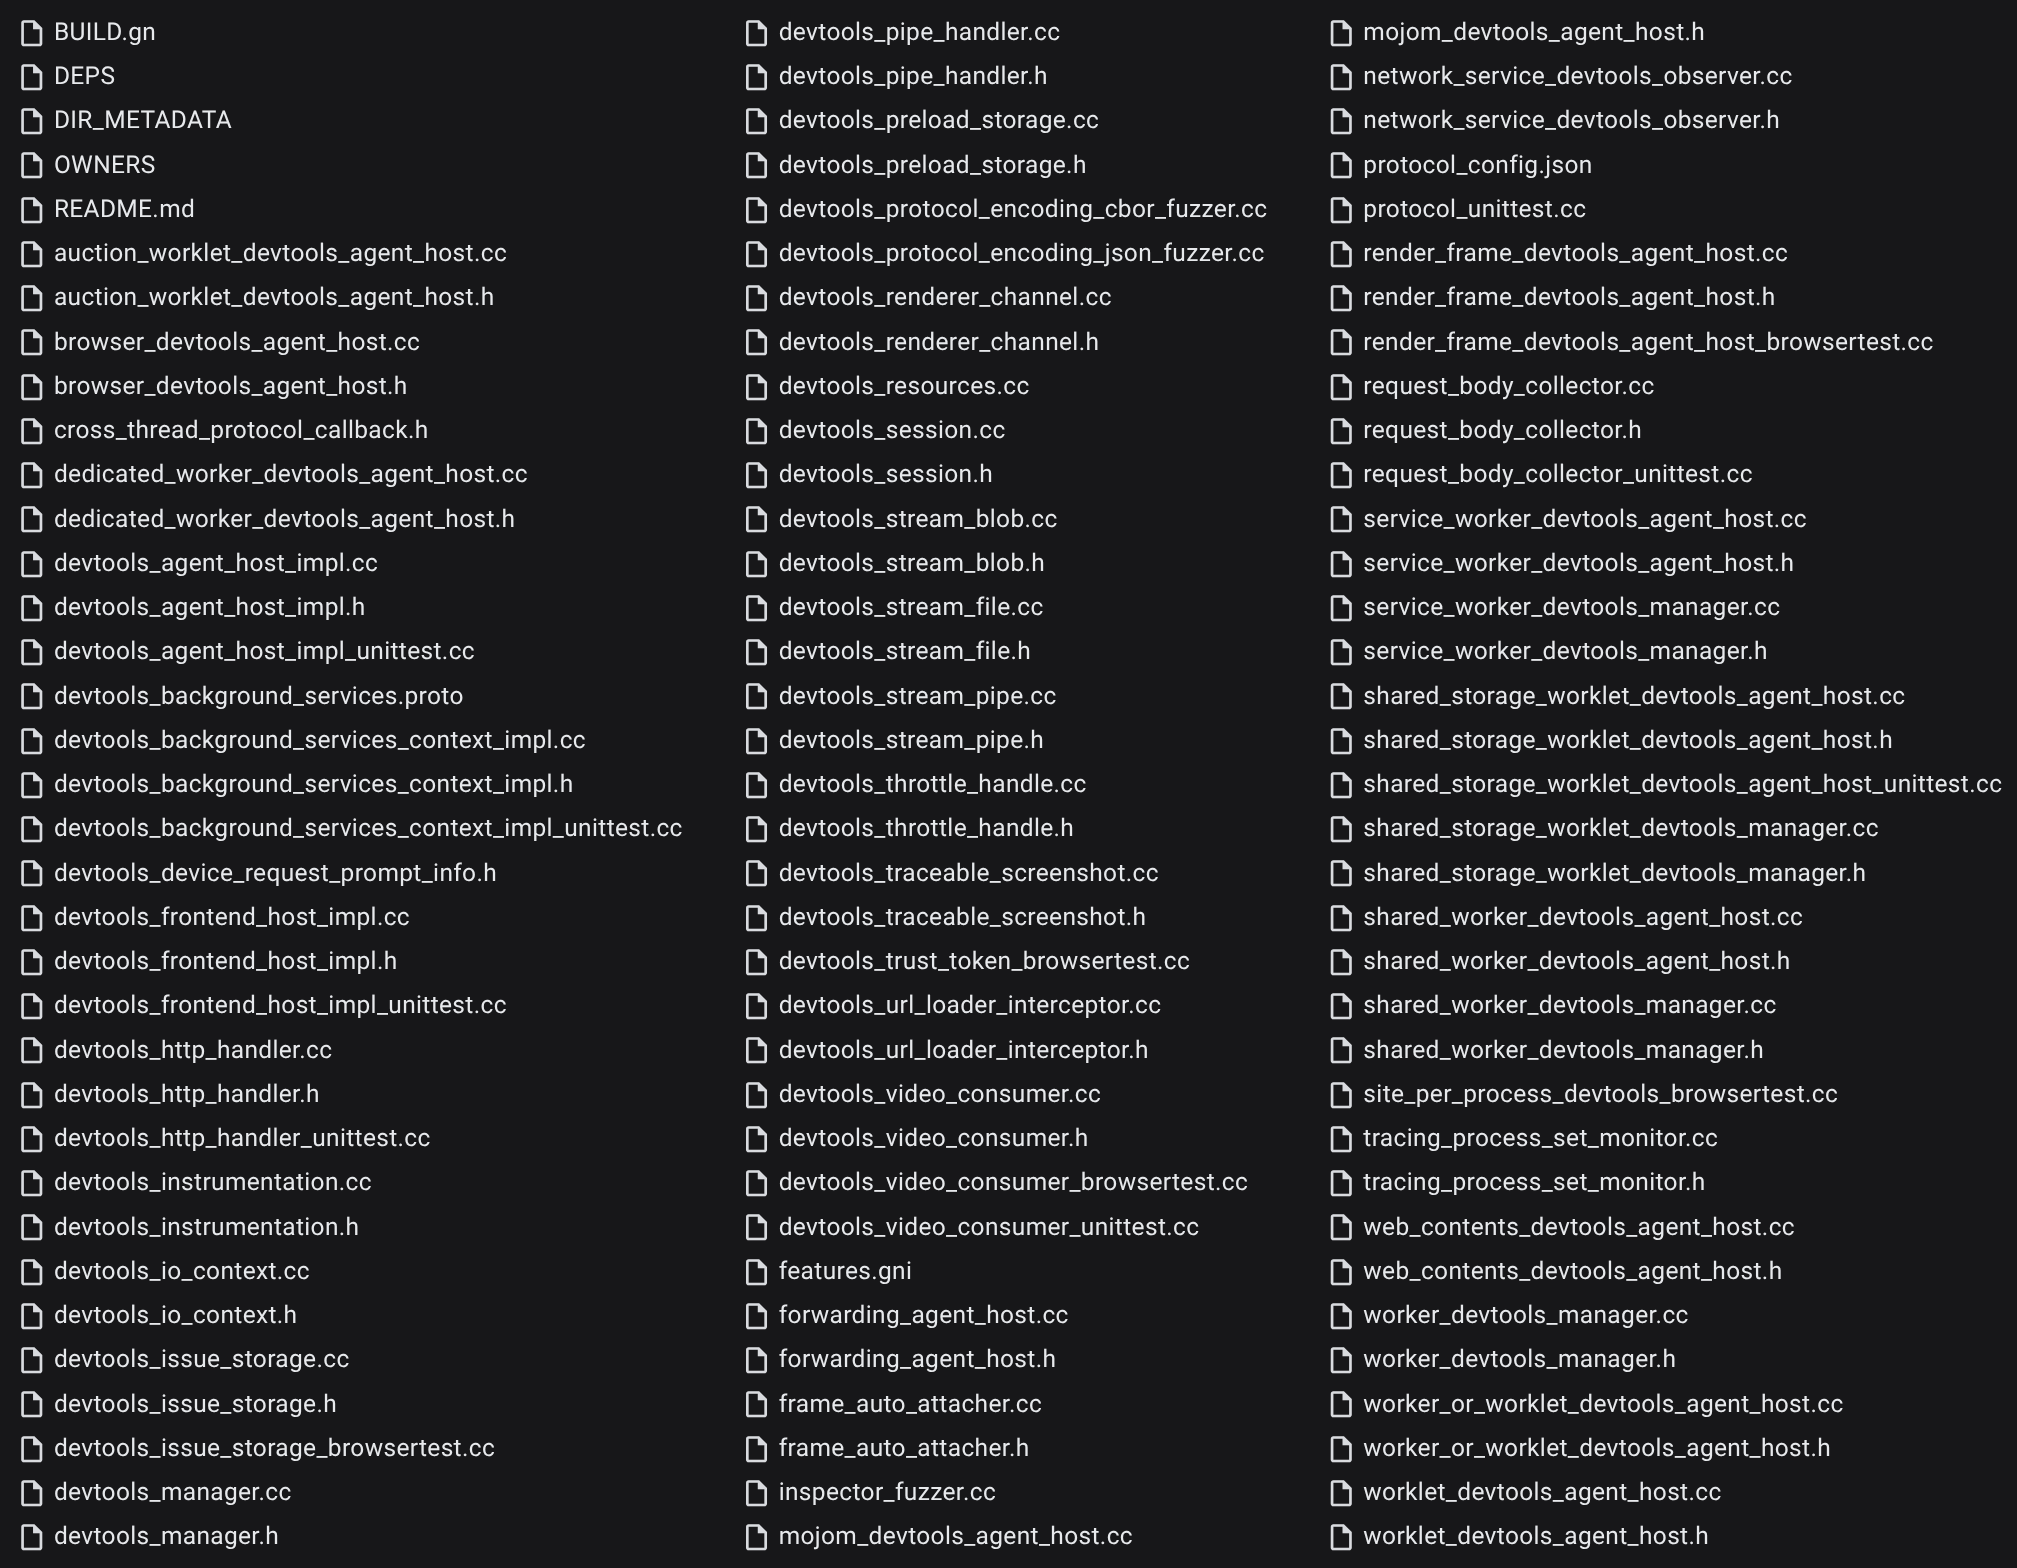
Within this directory, Chromium provides two different DevTools handler implementations:
devtools_http_handler: serves DevTools over an HTTP serverdevtools_pipe_handler: communicates via Unix or Windows pipes
These correspond to the various command-line flags Chrome exposes for enabling DevTools over different transports:
- remote-debugging-address: Use the given address instead of the default loopback for accepting remote debugging connections. Note that the remote debugging protocol does not perform any authentication, so exposing it too widely can be a security risk.
- remote-debugging-io-pipes: Specifies pipe names for the incoming and outbound messages on the Windows platform. This is a comma separated list of two pipe handles serialized as unsigned integers, e.g. "--remote-debugging-io-pipes=3,4".
- remote-debugging-pipe: Enables remote debug over stdio pipes or over the remote pipes specified in the 'remote-debugging-io-pipes' switch. Optionally, specifies the format for the protocol messages, can be either "JSON" (the default) or "CBOR".
- remote-debugging-port: Enables remote debug over HTTP on the specified port.
- remote-debugging-socket-name: Enables remote debug over HTTP on the specified socket name.
- remote-debugging-targets: Provides a list of addresses to discover DevTools remote debugging targets.
(From https://peter.sh/experiments/chromium-command-line-switches/)
After exploring both implementations, I chose to focus on the pipe handler. Its architecture is significantly simpler and easier to extend for our needs.
Pipe Handler Workflow
You can explore the implementation here: https://source.chromium.org/chromium/chromium/src/+/main:content/browser/devtools/devtools_pipe_handler.cc
At first glance the code may look intimidating, but the overall workflow is actually fairly straightforward.
DevToolsPipeHandler::DevToolsPipeHandler is instantied with read and write descriptors:
devtools_pipe_handler.cc - DevToolsPipeHandler
click to expandA new DevTools agent is then created through DevToolsAgentHost::CreateForBrowser
Next, the remote-debugging-pipe argument is parsed to determine which protocol format to use:
The pipe handler supports two modes: CBOR and ASCII. (If you're unfamiliar with CBOR, think of it as a compact binary encoding of JSON.) Depending on which mode is selected, Chromium instantiates either PipeReaderCBOR or PipeReaderASCIIZ, both subclasses of PipeReaderBase.
Reader: reading messages from the DevTools client
devtools_pipe_handler.cc - Reader Classes
click to expandWriter: Write messages to the DevTools client
devtools_pipe_handler.cc - Writer Classes
click to expandBoth the Reader and Writer run concurrently, each operating on its own descriptor.
When the Reader receives data, it parses the message according to the selected encoding and then forwards it to PipeReaderBase::HandleMessage:
This method posts the work to the UI thread, where the local DevTools handler processes the instruction and applies it to the page.
The Writer, in turn, is responsible for sending responses back to the client. When an outgoing DevTools message is ready, it triggers DevToolsPipeHandler::HandleMessage (note: this is distinct from PipeReaderBase::HandleMessage) that then call PipeWriter*::Write:
And that’s the full message round-trip: commands flow in through the Reader, actions execute on the UI thread, and results flow out through the Writer.
The HTTP-based DevTools handler follows the same logical structure, though with extra layers to support the added complexity of HTTP.
Implementing our own handler
If we want to introduce our own DevTools handler with Redis support, the first step is implementing a Redis client in C++.
There are several existing libraries we could pull in, but managing external dependencies along with build configurations, can get complicated inside Chromium’s build system. To avoid that friction, I opted to implement a minimal Redis client myself, using standard library as much as possible.
It’s intentionally lightweight, not feature complete, just enough to support the message patterns we need. And, for better or worse, this is what ChatGPT originally generated:
redis_client.cc
click to expandI placed this Redis client implementation in the same directory as the existing DevTools files, and added it to content/browser/BUILD.gn so Chromium’s build system would pick it up.
Next, rather than introducing a brand-new handler type (and dealing with the complexity of wiring it into the build system), we’ll modify the existing pipe handler directly. This approach keeps the changes localized and ensures the browser behaves as intended as long as the patch is applied.
The first step is to adjust how the remote-debugging-pipe argument is parsed. Instead of treating it as a mode selector, we reinterpret it as a value in the format:
<uuid>@<host>:<port>This allows us to specify the Redis endpoint to connect to and assign a unique identifier for the browser instance. From there, we create both redis_client_ and redis_client_subscriber_. Here’s how I implement this:
We can then inject redis_client_subscriber_ into our Reader and Writer classes, together with the channel name derived from the provided <uuid>. This setup allows each browser instance to communicate over its own isolated Redis channels.
During initialization, the handler also publishes a message to the create:callback channel to notify the client that the browser is ready, so the automation can begin immediately after setup completes. Here’s how I implement that step:
Now that our Redis subscriber is wired up, we can update the Reader so it pulls messages from Redis PUBSUB on the uuid + ":read" channel:
devtools_pipe_handler.cc - Reader Classes Patch
click to expandA lot is happening here. We drop the original PipeReaderBase::ClosePipe and PipeReaderBase::ReadBytes logic entirely, this class now simply stores references to our redis_client and the channel name.
Both PipeReaderASCIIZ::ReadLoopInternal and PipeReaderCBOR::ReadLoopInternal receive similar simplifications. Since all we need is the next message from Redis, each method now forwards incoming messages directly to the UI thread. In doing so, both modes behave identically, so CBOR support ends up effectively removed.
Next, we apply the same transformation to the Writer:
devtools_pipe_handler.cc - Writer Classes Patch
click to expandAs with the Writer, we strip out all unused pipe logic and replace it with our Redis-based implementation, which publishes messages to the uuid + ":write" channel. There’s one catch: RedisClient::Publish is relatively slow, so we dispatch it to a task runner thread, allowing both PipeWriterASCIIZ::WriteIntoPipe and PipeWriterCBOR::WriteIntoPipe to return early without blocking execution.
And that's it!
Using it
After compiling Chromium with the patch, you can launch it and connect to Redis like this:
$ chromium-browser --remote-debugging-pipe="5b032229-1d6e-43e2-9369-44a3d11b2a55@127.0.0.1:6379"From there, publishing DevTools commands to 5b032229-1d6e-43e2-9369-44a3d11b2a55:read will execute them inside the browser. The results will then be available on 5b032229-1d6e-43e2-9369-44a3d11b2a55:write.
On its own this isn’t particularly convenient, since DevTools clients only speak WebSocket. But adding a small WebSocket-to-Redis gateway solves that immediately:
app.js - WebSocket <-> Redis gateway
click to expandWith that in place, you can create and connect to any remote browser simply by pointing your DevTools client to the gateway:
test.js
click to expandConclusion
It’s certainly not the prettiest patch, but it worked, and it worked well. It allowed us to scale to tens of thousands of sessions, with browsers spinning up reliably and no lost packets along the way.
There's a lot more that goes into a production ready, high scale on-demand browser service. I'll cover more of those pieces in follow-up posts.